|
|
|
Visions, plans and consensus The objectives-led approach and problem-oriented planning Responsibilities and influences Formal and informal participation Planning horizons External factors and influences Visions, plans and consensus. It is possible, from the literature, to identify three distinct approaches to decision-making which may be adopted in any particular city:
These three approaches are necessarily simplified, and cities may well in practice adopt a mix of approaches. The table below indicates that the most common approach amongst European cities is a mix of plan-led and consensus-led decision-making; the least common approaches are those which tend either towards vision-led or towards plan-led decision-making. The table also shows that amongst northern and eastern European cities there is a higher preponderance of cities who adopt approaches which are a mix of plan-led and consensus-led. Closer scrutiny of responses, disaggregated by size of population, reveals that 14 out of the 19 larger cities (those with population greater than 250000) adopt an approach which is a mix of plan-led and consensus-led, whilst there is more variation in the type of approach amongst medium-sized and smaller cities.
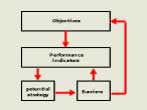
The objectives-led approach and problem-oriented planning While many cities adopt elements of a plan-led approach, these can take two principal forms. The first is the true Objectives-Led Approach in which broad (or more detailed) objectives of the kind described below are first specified, typically by the local authority or its elected members. These are then used to identify problems by assessing the extent to which current, or predicted future conditions, in the absence of new policy measures, fail to meet the objectives. This approach has been adopted in many integrated transport studies (May and Roberts, 1995). Having specified a set of objectives, these studies have then predicted future conditions, were nothing new to be done, and have compared these conditions with the objectives to identify future problems. In some cases this list of problems has then formed the basis for discussions with elected members or the public to see whether they have different perceptions of the problems. If they do, these are then used to redefine the objectives to match their concerns. The main drawback with this approach is that many politicians and members of the public are less familiar with the abstract concept of objectives (such as improving accessibility) than they are with concrete problems (such as the nearest job centre being 50 minutes away). It is to bridge this gulf that some integrated transport studies have checked the predicted problems with politicians and the public. The alternative Problem-Oriented Approach is to start by defining types of problem, and to use data on current (or predicted future) conditions to identify when and where these problems occur. The objectives are implicit in the specified problems, and may never actually be stated. This approach has been used in a number of studies of smaller conurbations (Coombe et al, 1990). It has the merit of being easily understood. However, it is critically dependent on developing a full list of potential problems at the outset. If particular types of problem (like access to job centres) are not identified because the underlying objective (accessibility) has not been considered, the resulting strategy will be partial in its impact. It is thus probably still wise to check with politicians and the public that the full set of problems has been identified. Responsibilities and influences It is rarely the case that a city will have total control over all aspects of land use and transport policy. Often responsibility is shared with a higher or lower tier authority, or with adjacent authorities. In some cases a separate agency may have direct control over a particular policy area, or that area may have been privatised, leaving the city with little or no influence. These differences in responsibility complicate decision-making, and may well limit the ability to pursue an integrated approach to strategy formulation. From the accompanying figure it can be seen that in all cities there is some division of responsibility across the different policy areas. Significant proportions of cities have exclusive responsibility for land-use (67%) or for traffic management (50%); and have joint responsibility for road building (69%), for public transport infrastructure (59%) or for information provision (54%). Almost half of the cities (48%) stated that public transport operations were not their responsibility, whilst a significant minority of cities (34%) stated that pricing measures were not their responsibility. However, when considering the policy areas together it is apparent that there is much diversity in the precise mix of responsibilities amongst European cities, making it difficult to identify any particular patterns. The pattern of responsibilities was very similar for different sizes
of city. However, two thirds of the smaller cities manage their various
responsibilities within a single department, where as almost two thirds
of the medium-large cities do not. Across the whole range of cities, only
35% of cities manage their various responsibilities together. Responsibilities in survey cities (number of cities)
Even where cities have direct responsibility, they may well be influenced strongly by adjacent authorities, by regional bodies, and by national or supra-national government. The level of influence on decisions in European cities from other levels of government is seen in the table below. All cities' decisions are influenced to some extent by other governmental authorities. The strongest influence comes from adjacent authorities; that from the EU is much the weakest. The influence of regional authorities is greater for smaller cities; conversely they are influenced least by national government. Authorities and their influence in 54 survey cities
Participation is an area in which practices differ greatly between countries. Some cities are required to consult with the public and business interests; some do so informally; few do so intensively (Flyvbjerg, 1998). Consultation can also take several forms, from comprehensive participation in decision-making to public inquiries into specific proposals. While there is a widely held view that the former is preferable, the latter is the norm in many cities. The main types of interest group are often business, environmentalists, transport users, the general public and the media. Some may be more fully consulted, while others may have a greater influence on decisions. The table below summarises the position in European cities. Three quarters of those responding involve business interest groups formally in decision-making; 60% do so for environmental and transport user groups and the general public. Conversely only 40% involve the media formally. A substantial majority consider that business interests and the general public have a strong influence on decisions. Half consider that environmental groups and the media do, but only a third think that transport users have much influence. Larger cities are more likely to involve business, environmental and transport user groups in decision-making, and less likely to involve the media; there were no differences for involvement of the public. Similar patterns were found for the influence of each of these groups, with the exception that smaller cities thought environmental and user groups had much less influence.
Planning horizons
Within the timescale for even medium term planning, the context for decision-making can change markedly. All but seven of the 54 European cities surveyed identified major changes in the past decade. Twelve mentioned objectives which had become more important; for most this was the environment and sustainability, but two mentioned safety and one each equity, congestion relief, energy and quality. Five mentioned economic trends, predominantly growth. Seven mentioned the introduction of a new strategy at either local or national level. Twenty identified new policy measures being introduced; these were predominantly public transport and demand management, but five mentioned new roads. Eight referred to new land use policies, with all but one involving tighter controls and increased densities. Six mentioned improvements in government decision-making processes. Four from Eastern Europe listed reductions in public ownership. Seven identified financial or public acceptability constraints. The same number identified major changes which would influence future
policy. Eight mentioned objectives which would become more important;
again these were mainly environment and sustainability, but two mentioned
quality and one energy. Five anticipated substantial urban growth. Two
mentioned the introduction of a new local or national strategy. The majority
listed policy measures which would become more important. Of these 18
were public transport improvements and 13 demand management, including
three listing road pricing; five mentioned new roads. Ten anticipated
greater control over land use, and increased density of development. Eight
expected improvements in government decision-making structures, two reduced
public ownership and involvement, and two greater public involvement.
|
||||||||||||||||||||||||||||||||||||||||||||||||||||||||||||||||||||||||||||||||||||||||||||||||||||||||||||||||||||||||||||||||||||||||||